Smoothiecharts, Python, Flask & Socketio
OK a long time ago i got gauges working with flask-socketio for a home monitoring project and that’s all documented here in a github repo: Gauges, flask-socketio
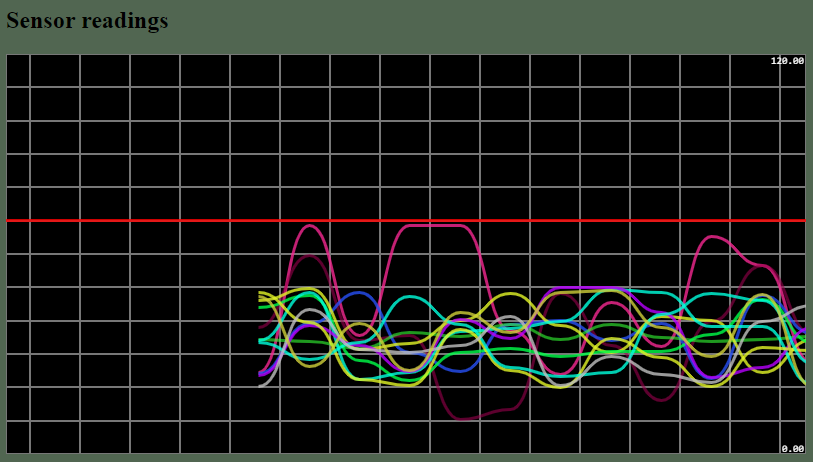
Fast forward to now and i have a use for realtime line graphs, searching i came across the smoothiecharts api, and it looked perfect for my needs. Initially i followed some leads and ended up with the python program launched using a bash wrapper and followed by commandline websocket ie
bash code snippet start
sudo nice -20 python3 multi_app.py > log.txt &
websocketd --port=8080 --staticdir=./static --sameorigin=true tail -f log.txt
bash code snippet end
So what the above does is run my script which collects data and prints it to a file, the websocket element simply uses the unix tail command to read the last line of the continually updated file.
most of the “heavy lifting” is done inside the webpage served by the last line of the bash script and that is
html code snippet start
  <script type="text/javascript">
    var L1 = new TimeSeries();

    function createTimeline() {
        var chart = new SmoothieChart(
            {grid:{verticalSections:12},

        interpolation:'bezier',
        minValue:0.0,
             maxValue:120,
       horizontalLines:[{color:'#ff0000cc',lineWidth:3,value:70}]
      });
      chart.addTimeSeries(L1, {
          strokeStyle: 'rgba(245, 40, 145, 0.8)',
          lineWidth: 3 });

  chart.streamTo(document.getElementById("chart"), 500);
    }

    var ws = new ReconnectingWebSocket('ws://192.168.50.15:8080/',null, {debug: true});
    ws.onopen = function() {
      document.body.style.backgroundColor = '#516651';
    };
    ws.onclose = function() {
      document.body.style.backgroundColor = null;
    };
    ws.onmessage = function(event) {
      var data = event.data.split(",");
      var timestamp = parseFloat(data[1]) * 1000;
      var data1 = parseFloat(data[2]);
      L1.append(timestamp, data1);
    };
  </script>
</head>
html code snippet end
Working through the above the first elements create the chart and its the ws.onmessage that splits and reads the data from the file and appends to the smoothiechart shown in the body element of the page created by;
html code snippet start
<body onload="createTimeline()">
  <h2>Sensor readings </h2>
  <canvas id="chart" width="800" height="400"></canvas>
</body>
html code snippet end
running it serves me with 12 temperature readings on a scrolling graph;
So i have a working websocket based realtime data visualisation system! I thought it should be simple to recreate the above but without needing the bash script and websocket element and instead bring it all into python using flask as per my earlier efforts with gauges.
In short - no - i think i am missing something blindingly obvious but at the moment after several frustrating days of attacking, leaving, re-attacking the problem i simply cannot get it displaying the lines. So what lies beneath is merely the information needed to get to the same point and hopefully someone will see what is hidden from me.
What happens is that the smoothie chart actually updates both the min and max values to the the incoming websocket value so i know it is receiving data but why both update at the same time?

The python code relies on downgrading the flask libraries as i had chosen to leave gauges enabled.
python code snippet start
import datetime, time
from flask import Flask, render_template
from flask_socketio import SocketIO, emit
from random import randint
import random
import pdb

# note downgrade some libraries
# Flask-SocketIO==4.3.1
# python-engineio==3.13.2
# python-socketio==4.6.0

async_mode = None

app = Flask(__name__)
app.config['SECRET_KEY'] = 'secret!'
socketio = SocketIO(app, async_mode=async_mode)
thread = None

def to_unix_timestamp(ts):
    start = datetime.datetime(year=1970, month=1, day=1)
    diff = ts - start
    # print(start, diff, diff.total_seconds())
    return diff.total_seconds()

def background_thread():
    x = 0
    while True:
        time.sleep(1)
        # socketio.sleep(2)
        # create the data to send to the browser\client
        ts = datetime.datetime.now()
        timestamp = to_unix_timestamp(ts)
        # timestamp = time.strftime("%H:%M:%S", time.localtime())
        # timestamp = time.time()

        test_var = (round(random.uniform(1,30),0))
        test_var1 = (round(random.uniform(0,28),0))
        x += 1
        # print to console for testing purposes could be output to file for saving\analysis
        print (ts,timestamp,test_var)
        # this is the msg we will send to the browser\client
        socketio.emit('my_response',
                      {'data':'Values', 'fr': test_var, 'timedata': timestamp, 'tc1': test_var, 'tc2': x},
                      namespace='/test')

mesg = 'starting dragelec'

@app.route('/')
def index():
    today = datetime.date.today()
    templateData={
        'mesg' :mesg,
        'time' :today
    }
    return render_template('index.html', async_mode=socketio.async_mode, **templateData)

@socketio.on('connect', namespace='/test')
def test_connect():
    global thread
    if thread is None:
        thread = socketio.start_background_task(target=background_thread)

@socketio.on('disconnect', namespace='/test')
def test_disconnect():
    print('Client disconnected')

if __name__ == '__main__':
    print("--------------- %s %s ---------------" %
          (datetime.date.today(), time.strftime("%H:%M:%S")))
    print("---------------------------------------------------")
    print("")
    socketio.run(app, host='0.0.0.0', debug=True)
python code snippet end
The webpage code is;
html code snippet start
<!DOCTYPE html PUBLIC "-//W3C//DTD XHTML 1.0 Transitional//EN" "http://www.w3.org/TR/xhtml1/DTD/xhtml1-transitional.dtd">
<html xmlns="http://www.w3.org/1999/xhtml">

<head>
<meta content="text/html; charset=utf-8" http-equiv="Content-Type" />
<title>Pi data</title>
<script src="static/gauge.min.js"></script>
<script type="text/javascript" src="static/jquery-3.2.1.min.js"></script>
<script type="text/javascript" src="static/smoothie.js"></script>
<script type="text/javascript" src="static/reconnecting-websocket.min.js"></script>
<script type="text/javascript" src="static/socket.io-1.3.5.min.js"></script>

<script type="text/javascript">
//tc1 = 1
//timestamp = 0
</script>

<script type="text/javascript" charset="utf-8">
      var myData = {};
      $(document).ready(function() {
      namespace = '/test';
          var socket = io.connect(location.protocol + '//' + document.domain + ':' + location.port + namespace);
          socket.on('connect', function() {
               socket.emit('my_event', {data: 'I\'m connected!'});
          });
          socket.on('my_response', function(msg) {

      // this is used for the dial gauge
      var frontroom = msg.tc1
      frontroomGauge.value = frontroom

      // defines variables instead of refering to incoming msg probably not needed
      window.timestamp = Math.round(parseFloat(msg.timedata) * 1000);
      window.tc1 = Math.round(parseFloat(msg.tc1, 10));
      var tc2 = parseFloat(msg.tc2, 10);


// websocket driven smoothie chart
var chart = new SmoothieChart();
chart.streamTo(document.getElementById("tcchart"), 1000 /*delay*/);
// Data
var data1 = new TimeSeries();

// Add a random value to each line every second
setInterval(function() {
  fakeTime = (new Date().getTime());
}, 1000);

// Add to SmoothieChart
chart.addTimeSeries(data1);
data1.append(timestamp, tc1);

      // the following outputs the rxd data to the html webpage using div elements
      document.getElementById('time').innerHTML = timestamp
      document.getElementById('thermo1').innerHTML = tc1
      document.getElementById('thermo2').innerHTML = fakeTime
      // document.getElementById('time').innerHTML =
 });
       });

    </script>

</head>

<body>
<h2>Sensor reading</h2>

<canvas id="tcchart" width="600" height="200"></canvas>

<script>
</script>

<h3>another attempt</h3>
<canvas id="mycanvas1" width="600" height="200"></canvas>
<script>
// testing smoothie charts without websocket data
var smoothie1 = new SmoothieChart();
smoothie1.streamTo(document.getElementById("mycanvas1"));
// Data
var line10 = new TimeSeries();
var line20 = new TimeSeries();

// Add a random value to each line every second
line10.append(timestamp, tc1());
//line2.append(new Date().getTime(), Math.random());

// Add to SmoothieChart
smoothie.addTimeSeries(line10);
// smoothie.addTimeSeries(line20);
</script>


<h2>test chart</h2>
<canvas id="mycanvas" width="600" height="200"></canvas>
<script>
// testing smoothie charts without websocket data
var smoothie = new SmoothieChart();
smoothie.streamTo(document.getElementById("mycanvas"));
// Data
var line1 = new TimeSeries();
var line2 = new TimeSeries();

// Add a random value to each line every second
setInterval(function() {
  line1.append(new Date().getTime(), Math.random());
  line2.append(new Date().getTime(), Math.random());
}, 1000);

// Add to SmoothieChart
smoothie.addTimeSeries(line1);
smoothie.addTimeSeries(line2);
</script>
<!-- showing what data is rxd -->
<h1> here be the data</h1>

<table>
<tr>
<th>rxd time:</th>
<th>tc1 value rxd:</th>
<th>tc2 value rxd:</th>
</tr>
<tr>
<th> <div id="time"></div></th>
<th> <div id="thermo1"></div></th>
<th> <div id="thermo2"></div></th>
</tr>
</table>

<!-- setting up the canvas gauge -->
<h2> canvasGauge</h2>
    <!-- frontroom -->
    <canvas id="frontroom-temp">  </canvas>
    <script>
      var frontroomGauge = new RadialGauge({
      renderTo: 'frontroom-temp',
      width: 200,
      height: 200,
      units: "Deg",
      minValue: 0,
      maxValue: 30,
      majorTicks: [
          "0",
          "10",
          "15",
          "20",
          "25",
          "30"
      ],
      minorTicks: 0,
      strokeTicks: true,
      highlights: [
      { from: 0, to: 10, color: 'rgba(25,0, 168, .8)'},
      { from: 10, to: 18, color: 'rgba(47, 15, 224, .7)'},
      { from: 18, to: 22, color: 'rgba(0, 204, 61, 0.9)'},
      { from: 22, to: 25, color: 'rgba(247, 151, 7, .5)'},
      { from: 25, to: 30, color: 'rgba(247, 31, 7, .9)'}
      ],
    colorPlate: "#fff",
    borderShadowWidth: 0,
    borders: false,
    needleType: "arrow",
    needleWidth: 2,
    needleCircleSize: 5,
    needleCircleOuter: true,
    needleCircleInner: false,
    animationDuration: 1800,
    // animationRule: "linear"
    })
      frontroomGauge.draw();
    </script>

      </body>

</html>
html code snippet end
Look its all a mess i know, i searched for info on smoothie and found comments that indicated it needed the timedata to match what the browser thinks the time is so i created “fake” time data using javascript and added that to the incoming value but nothing changed both the min & max are updated simultaneously and no lines.
The values are transmitted from the python code, the gauge updates, the <div> elements update even the damn chart updates but no lines are drawn.
I’ve stripped the code, re-factored it, deleted it, re-wrote it and no matter what i do it just cannot draw a line. Buggered if i know why. For now i’m consigning this to the back of the cupboard waiting a stiff shot of the good stuff before i re-attempt to understand why i’m wrong\it dont work.
Maybe i’ll just keep the bottle handy….