Comparing Data
After getting bokeh to graph data I started trying to compare years/months against each other eg June 2019 vs 2018 but this did not quite go to plan especially as i had forgotten that despite dragelec running for almost 5yrs the SQL recording only started in Aug 2018…
There is another issue; the way the data is recorded; i store values everytime a signal is output from one of the sensors this means when interrogating the data i can have a different number of values per day so a straight forward export of data does not work.
For example the following SQL select statement
python code snippet start
for row in curs.execute("SELECT * FROM home_mon WHERE DATE>(?) and DATE<(?)", ('2018-12-01', '2018-12-25')):python code snippet end
counts 6547 rows for December 2018 whilst the same for 2019 only counts 6516 this discrepancy is larger for some other months. So to compare periods i wrote the following to get one value per hour
python code snippet start
for row in curs.execute("SELECT * FROM home_mon WHERE DATE>(?)", (yr18,)):
    dat = dt.datetime.fromtimestamp(int(float(row[1]))).strftime('%Y-%m-%d %H:%M:%S')
    hr =  dt.datetime.fromtimestamp(int(float(row[1]))).strftime('%H:')
    if dat > "2018-12-01" and dat < "2018-12-25":
        if hr != pasthr18:
            pasthr18 = hr
            data_18.append(row[4])
    if dat > "2019-12-01" and dat < "2019-12-25":
        if hr != pasthr19:
            pasthr19 = hr
            data_19.append(row[4])

    cnt = cnt + 1
    x.append(cnt)
python code snippet end
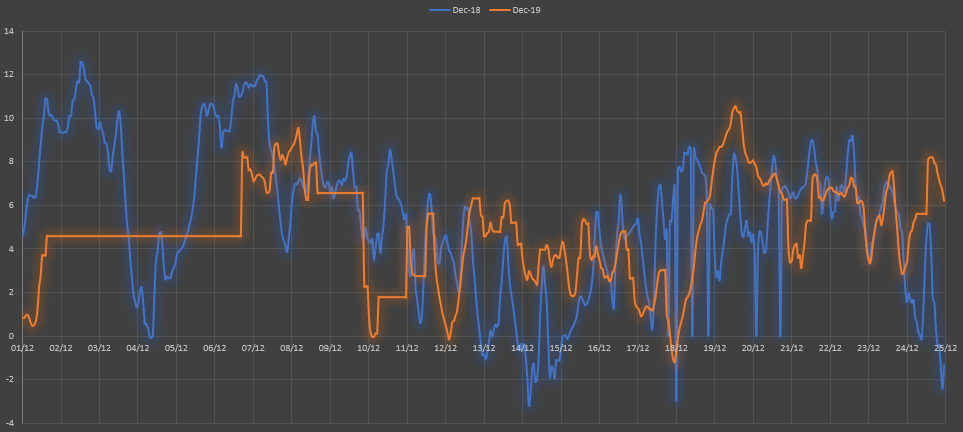
The result of this is for the periods 01-12 > 25-12 I get 576 values for both years meaning a real comparison can now be done.
So using bokeh to graph the period we get;

and the same in excel but tweaked to show date axis;
a bit of further exploration gives;
| Coldest recorded value | Time | Value |
|---|---|---|
| 14th December 2018 | 04:01:47 | -3.2 |
| 17th December 2019 | 23:01:51 | -1.18 |
| Warmest recorded value | Time | Value |
|---|---|---|
| 02nd December 2018 | 12:05:41 | 12.59 |
| 19th December 2019 | 13:02:53 | 10.56 |
Finally the average temperatures for the period 01st-25th December 2018 vs 2019
| AVERAGE | MIN | MAX | |
|---|---|---|---|
| Dec2018 | 5.41 | -3.2 | 12.59 |
| Dec2019 | 4.81 | -1.18 | 10.56 |
This year would appear to provide a warm start for the next with an almost 12degC rise from the 17th to 19th of December and as i’m writing this the grass is green, the sun is shining, it’s 7.4degC outside but if i ignore the lack of leaves on the trees it looks like a late summers evening.